The fast, intuitive GraphPad Prism alternative
Built for today’s scientists, BioRender Graphing takes you from raw data to publication-quality graphs in minutes. Run your analysis, create custom graphs, and move them straight into the figures you're already building in BioRender.
Why scientists are switching from GraphPad Prism
With data prep and analysis, AI-assisted editing, and real-time collaboration, BioRender Graphing removes the friction of working in Prism.
BioRender Graphing
Prism
Auto-Prepare
Drag and drop Prism, CSV, or Excel files and intelligently detect variables

Create and explore multiple graphs from the same dataset
Explore multi-well plate assay data with well plate heatmaps
Analyze
Review analysis guidance with clear explanations, backed by built-in pre-tests
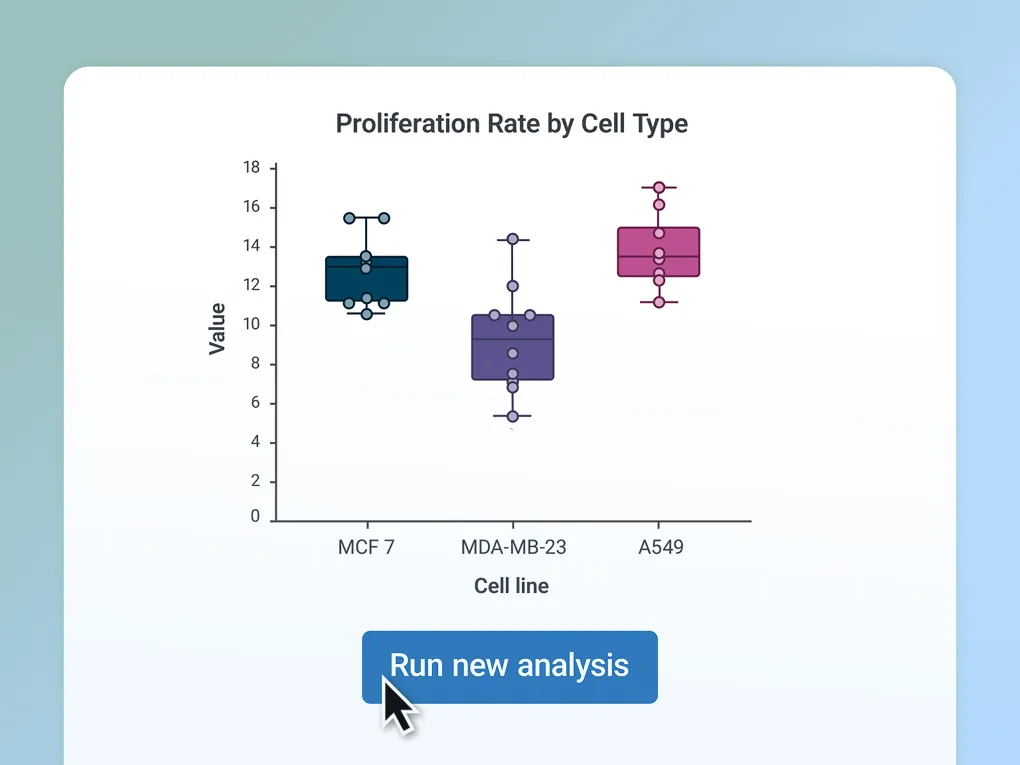
Have outliers automatically flagged on your graphs with one-click exclusion
Run core analyses, including dose-response modeling, standard-curve interpolations (for ELISA, qPCR, and more), t-tests, ANOVAs, and EC/IC (EC50/IC50)
Present
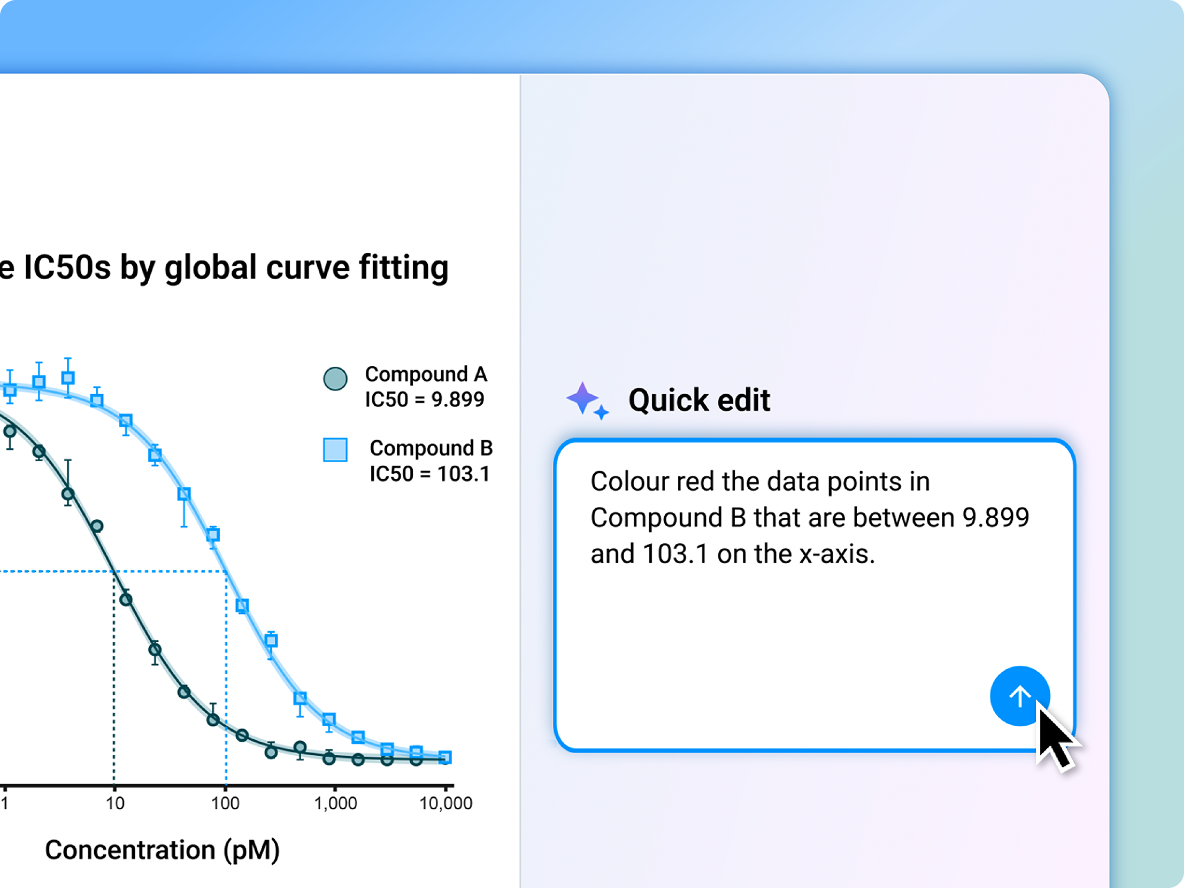
Edit colors, labels, and axes in seconds with BioRender AI (Beta)
Use one-click refreshes for live-linked graphs in PowerPoint and Google Slides
Apply matching styles across graphs
Collaborate
Collaborate and live-edit in the cloud from any device, no installation required
Easily rollback to previous versions of a graph
“We'd been running ANOVAs in Prism for years. When I imported those same files into BioRender Graphing, it flagged a non-parametric test as more appropriate, and it was right. That kind of built-in statistical guidance is something we didn't know we were missing.”

Thomas Prevot
Scientist and Assistant Professor
CAMH and University of Toronto

Learn How BioRender Graphing Works
With BioRender Graphing, you can run analysis and create custom graphs from raw data in minutes. Watch our demo on dose-response curves.
Get what you need with BioRender Graphing


Skip manual prep and get analysis-ready data in seconds
Drag and drop Prism, CSV, or Excel files and BioRender automatically formats your data for analysis. Explore multiple graph types from the same dataset, no restructuring required.

Run the right analysis, backed by automatic pre-tests
Review built-in analysis guidance and automatic pre-tests that explain which test is appropriate and why. Automatically detect outliers, then exclude them with one click.

Customize graphs without all the clicking
Describe updates to colors, labels, and axes and BioRender AI (Beta) edits in seconds. Edit graphs manually anytime, undo errors with one click, and live-link to PowerPoint and Google Slides.


Cut the back-and-forth with real-time collaboration
Work from one file to share analysis and update graphs with your team. Track version history, with easy rollback.
Spend less and replace multiple tools with one platform

No desktop installation required
Securely access in the cloud anytime, along with your other BioRender work.

Competitive pricing
Competitive pricing for academic and industry plans, available as a BioRender add-on. No additional costs for BioRender AI (Beta).

Everything in one platform
Combine graphing, analysis, and biology figure creation in one platform.

Stay in control of your data
BioRender is SOC 2 Type 2 certified, with encryption in transit and at rest. Your data is private by default, and access controls keep sensitive research data protected as your team grows. Learn more in BioRender’s Trust Center.
When you use BioRender AI (Beta) to customize a graph, your data remains untouched. We never read your data, change what your graph says, or train our models on what you upload.
Frequently asked questions
What is BioRender Graphing?
BioRender Graphing is a cloud-based scientific data analysis and graphing tool for life science researchers. It supports t-tests, ANOVAs, nonparametric tests, dose-response with global curve fitting and EC50/IC50 (EC/IC) calculations, and Kaplan-Meier survival analysis, with automatic data formatting, outlier detection, and statistical test recommendations. Graphs are publication-quality from the start, easy to customize with BioRender AI (Beta), and sync across presentations. Access from any browser and on any device, no installation required.
Does BioRender Graphing support the same graph types and analyses I use in Prism?
BioRender Graphing supports the analyses scientists rely on most, including dose-response, standard-curve interpolation (for ELISA, qPCR, and more), t-tests, ANOVAs, Kaplan-Meier survival analysis, and more, all computed in R for reproducible, citable results. For modeling relationships: simple linear regression, simple logistic regression, correlation, and nonlinear modeling of growth, decay, and dose-response. For interpolation: standard curve fitting, with calculation of unknown concentrations from linear and nonlinear regressions. For comparisons between groups: t-tests, one- and two-way ANOVAs, with nonparametric alternatives. For survival analysis: Kaplan-Meier survival analysis and Cox proportional hazards regression. Statistical assumption checks include outlier detection (ROUT method), Shapiro-Wilk test of normality, and Levene's test of equal variances. All statistical analyses are computed in R, with full transparency on the packages and functions used, ensuring your methods are reproducible and citable.
In addition to statistical analyses, BioRender Graphing supports publication-quality graph types including bar, column, line, scatter, pie, grouped, and boxplot charts, as well as survival curves, dose-response curves, heatmaps, and well plate heatmaps. Violin plots, forest plots, and volcano plots are coming in late 2026. Review the full list of supported graph types and statistical tests.
Is BioRender’s cloud-based platform as secure as desktop-only solutions like Prism?
Yes, BioRender is SOC 2 Type 2 certified, with encryption, access controls, and continuous vulnerability monitoring that keep sensitive research data protected, even as your team grows. For more details, visit the BioRender Trust Center.
When you use BioRender AI (Beta) to customize a graph, your data remains untouched. We never read your data, change what your graph says, or train our models on what you upload.
Can I use my graphs in presentations, publications, and posters?
Yes. Graphs in Graphing match the look and feel of your other BioRender figures and can easily be added to any of your BioRender presentations or posters in high resolution. Once added to your BioRender canvas, graphs live link to PowerPoint or Google Slides.
How do I transition from Prism to BioRender Graphing?
Simply drag and drop your Prism files into Graphing. Your Prism graphs are automatically recreated in the BioRender style, with your analyses intact. Learn how to import GraphPad Prism files.
With BioRender Agentic Graphing (Beta), you can skip the learning curve for editing a graph. Instead of hunting for settings, just describe the changes you need to colors, labels, and axes.
Is BioRender Graphing included in my BioRender subscription?
BioRender Graphing is included in all plans, with one free file and up to three datasets. To get unlimited Graphing files, BioRender subscribers with a paid plan can purchase the Graphing Add-On. Individual paid plan subscribers can log in to purchase the Graphing Add-On. If you’re on a team plan, reach out to your Admin to add the Graphing Add-On to your subscription. For pricing details, visit BioRender's pricing page or contact your CSM to learn more.
Ready to try BioRender Graphing?
Turn your raw data into publication-quality graphs today.