Transform raw data into publication-quality graphs in minutes
Scientific data analysis and graphing software for life science researchers.
Try It Free

Skip manual prep and get analysis-ready data in seconds
- Drag and drop Prism, CSV, or Excel files
- Intelligently detect variables
- Explore different graphs from the same dataset
Run the right analysis, backed by automatic pre-tests
- Automatically detect outliers, exclude in one click
- Get statistical test recommendations with clear explanations
- Compare graphs side-by-side for faster insights
- Analyses run in R, fully documented and citable
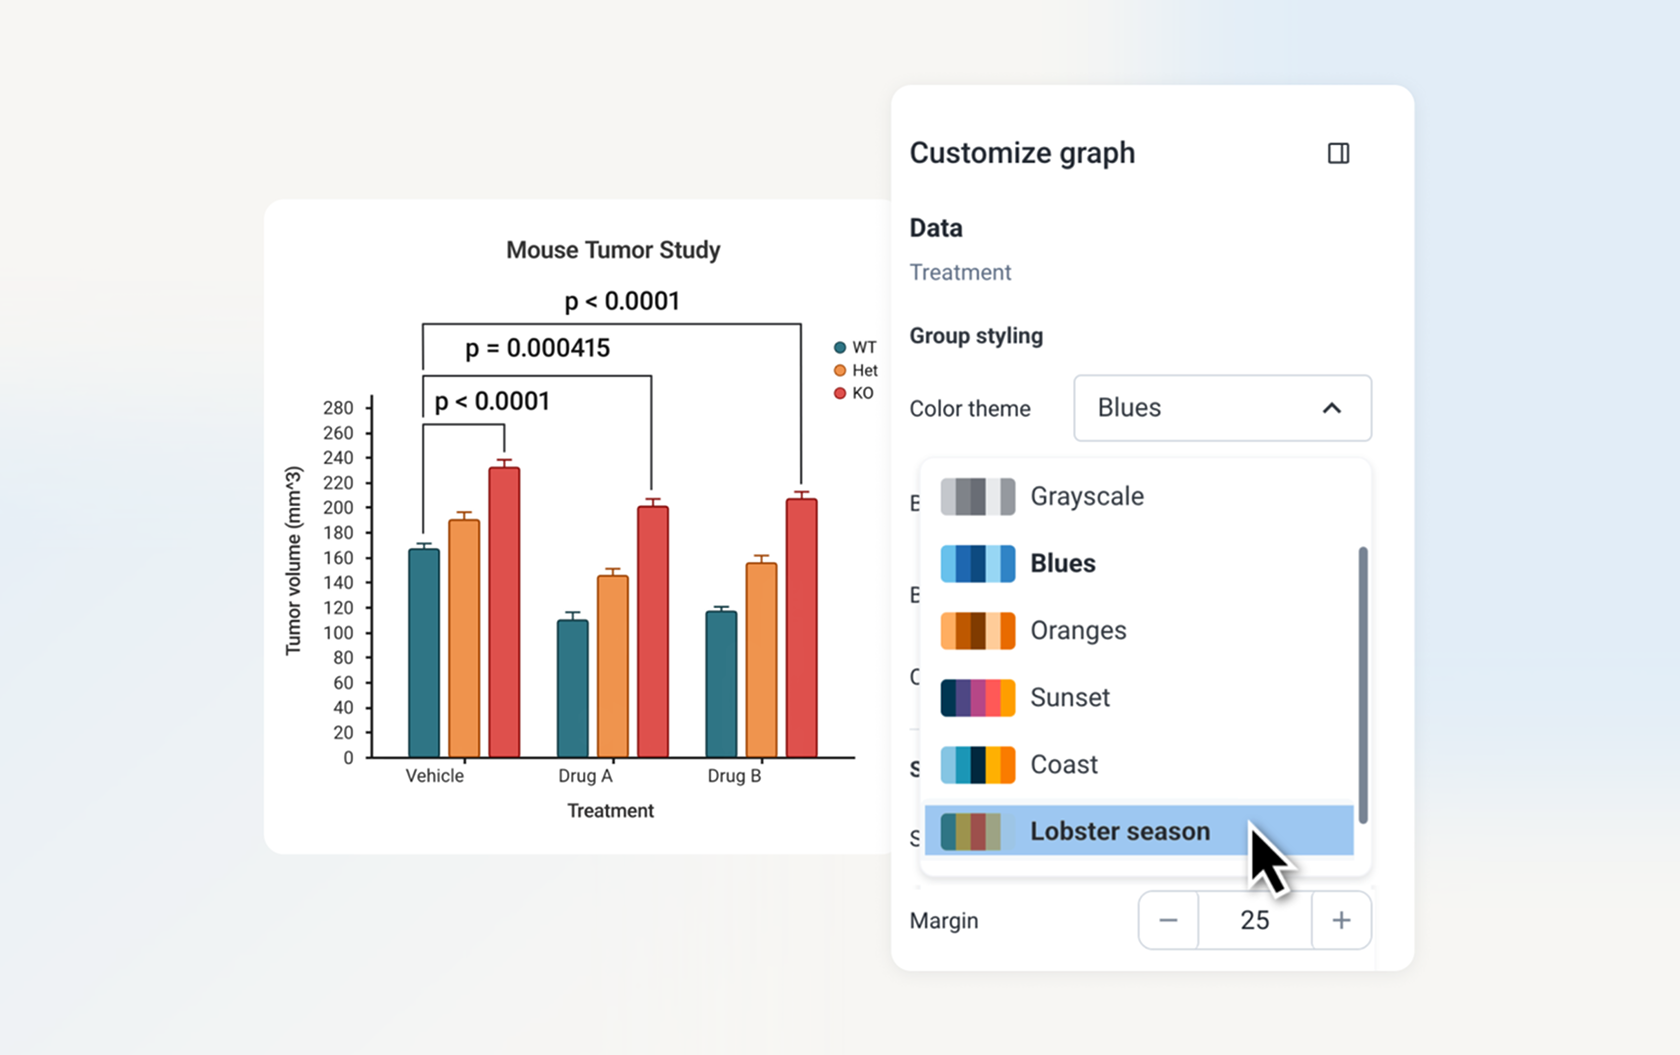
Customize graphs and match styles in a few clicks
- Live-edit colors, labels, and axes
- Make visually consistent graphs with Style Match
- Live-link to PowerPoint and Google Slides
Access from anywhere, collaborate in real-time
- Share files and co-edit graphs with your team
- Access your work from any device with cloud-based scientific graphing
- Track version history with easy rollback


Statistical analysis tools built for life science research
t-test & ANOVA tools for group comparison
Compare outcomes across groups using t-tests, ANOVAs, and nonparametric alternatives, including post hoc comparison tests.

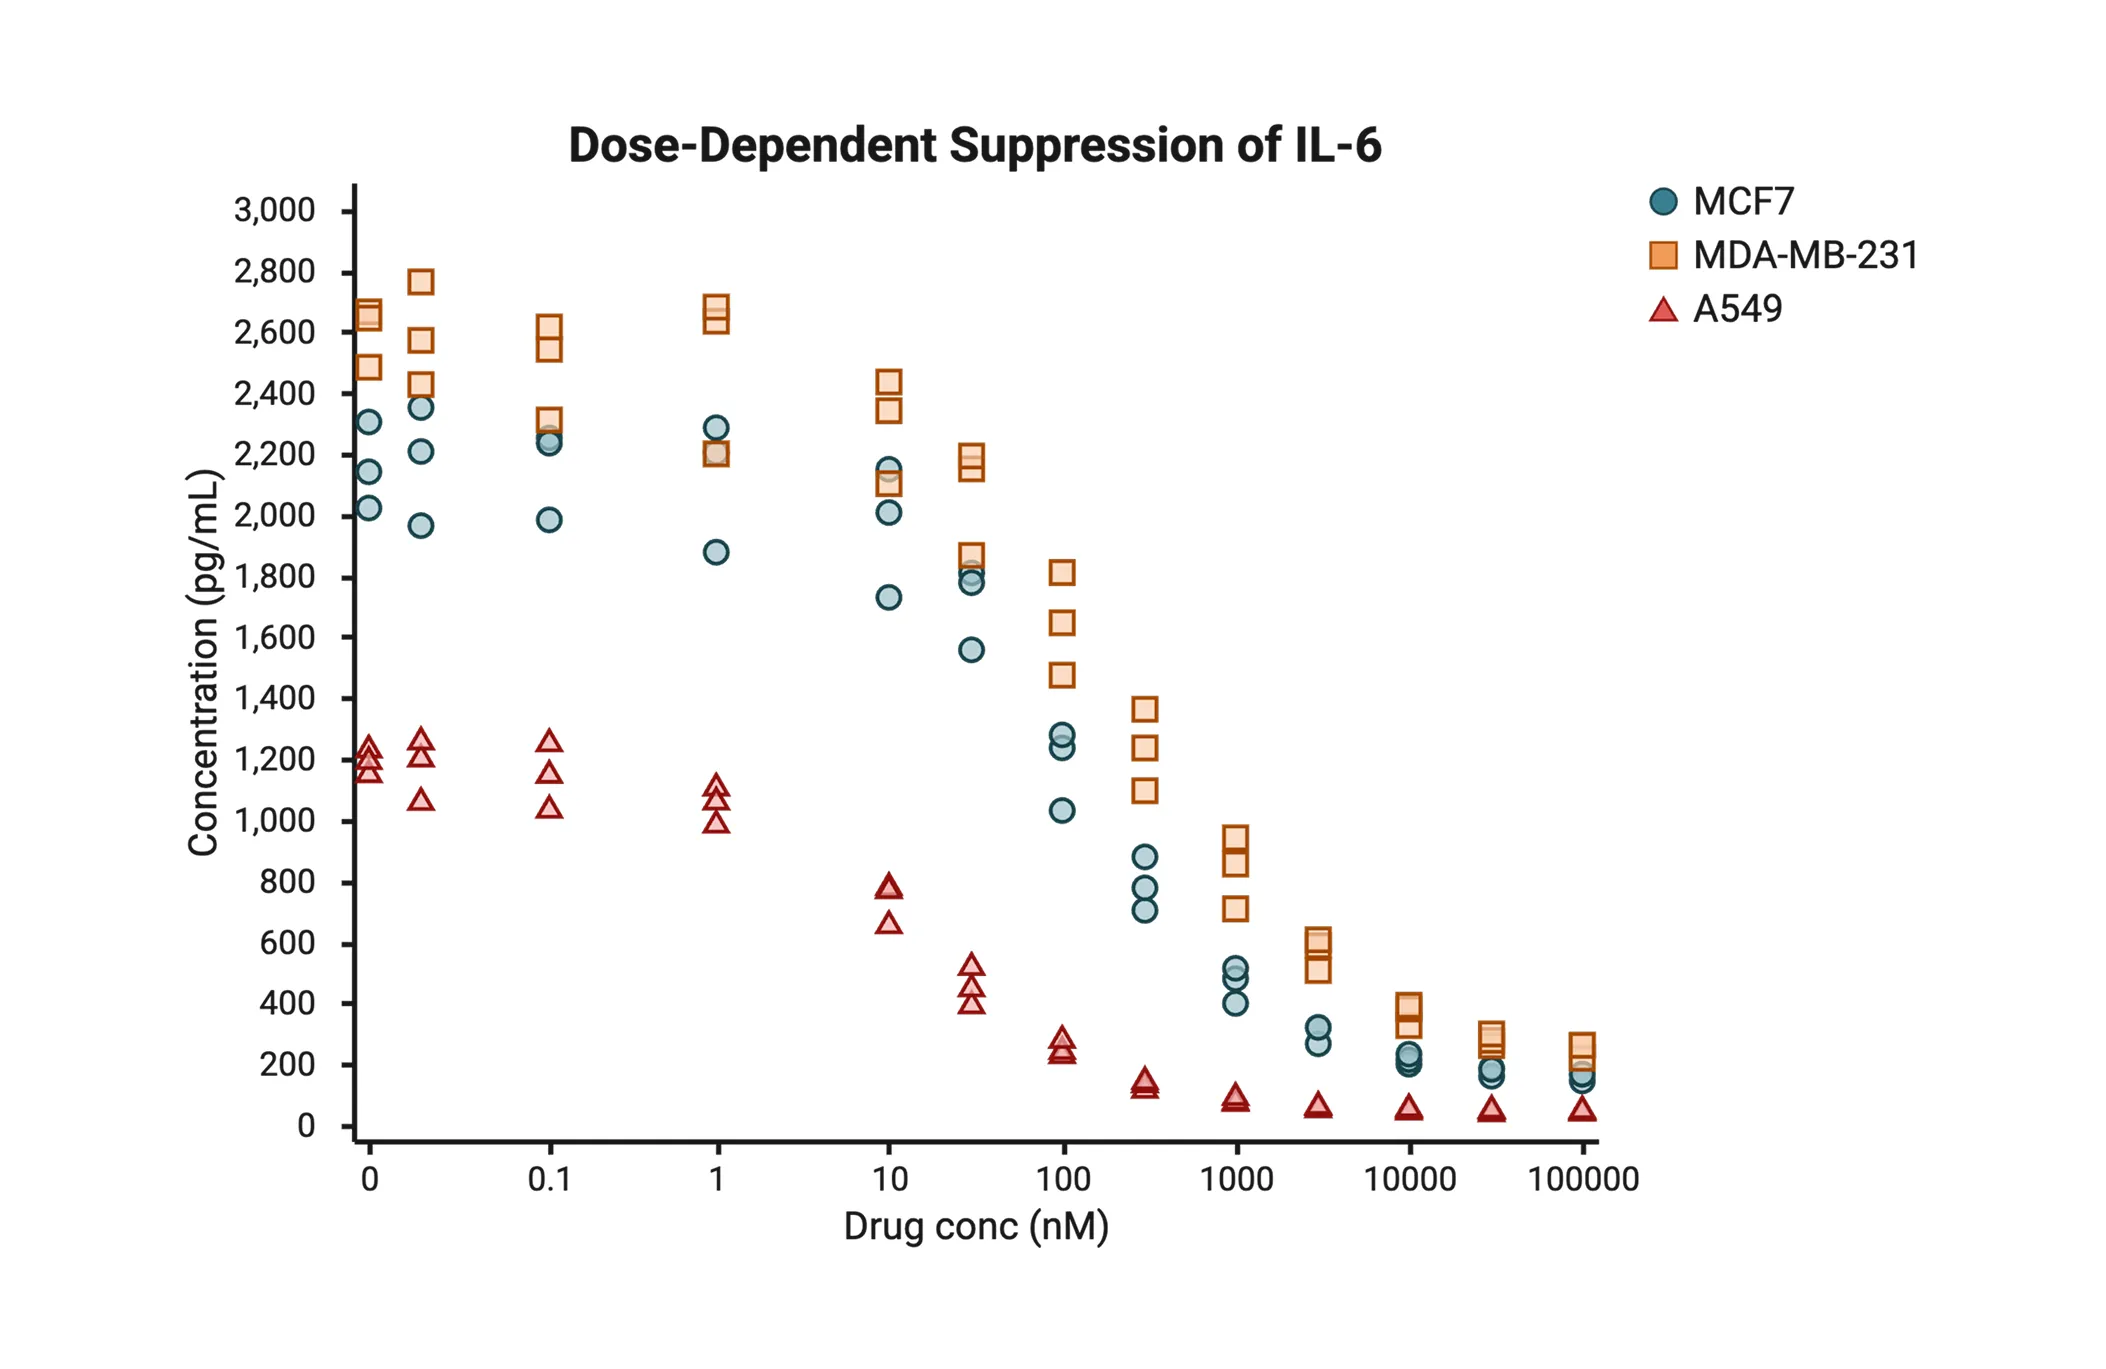
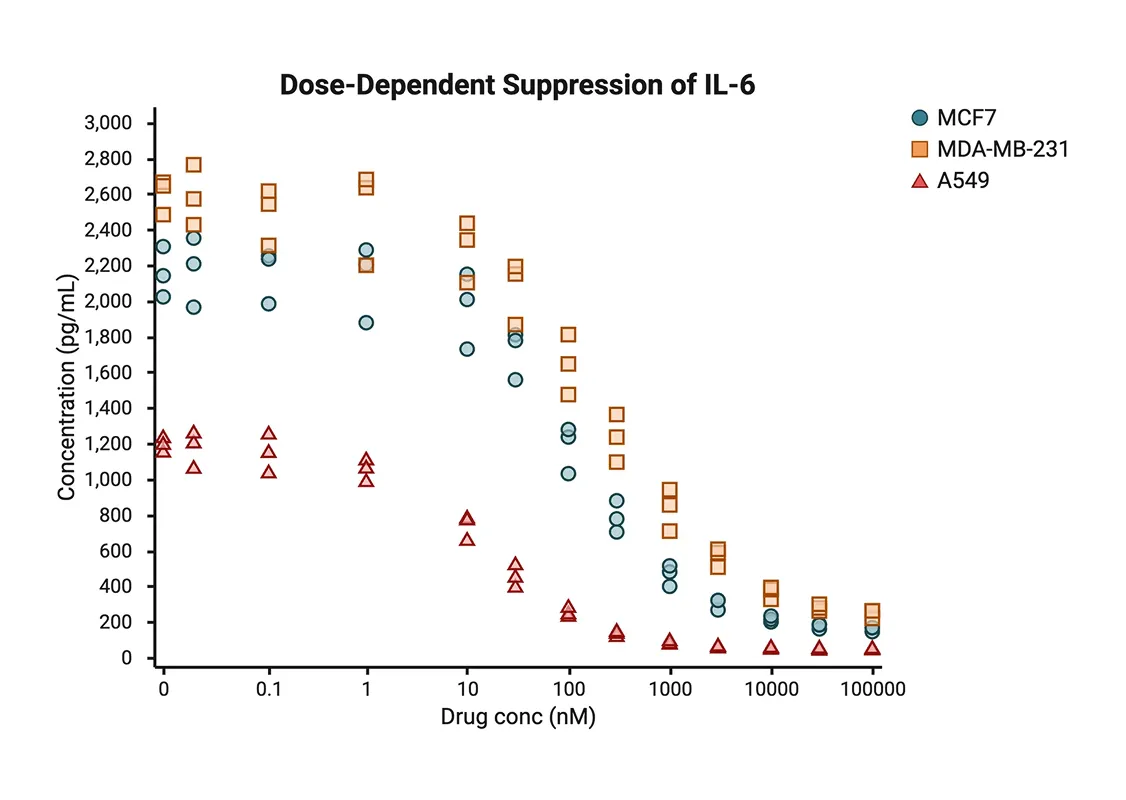
Dose-response curve software with EC50/IC50 calculation
Run non-linear regressions to generate best-fit curves, confidence intervals, and calculate EC50 and IC50 values.
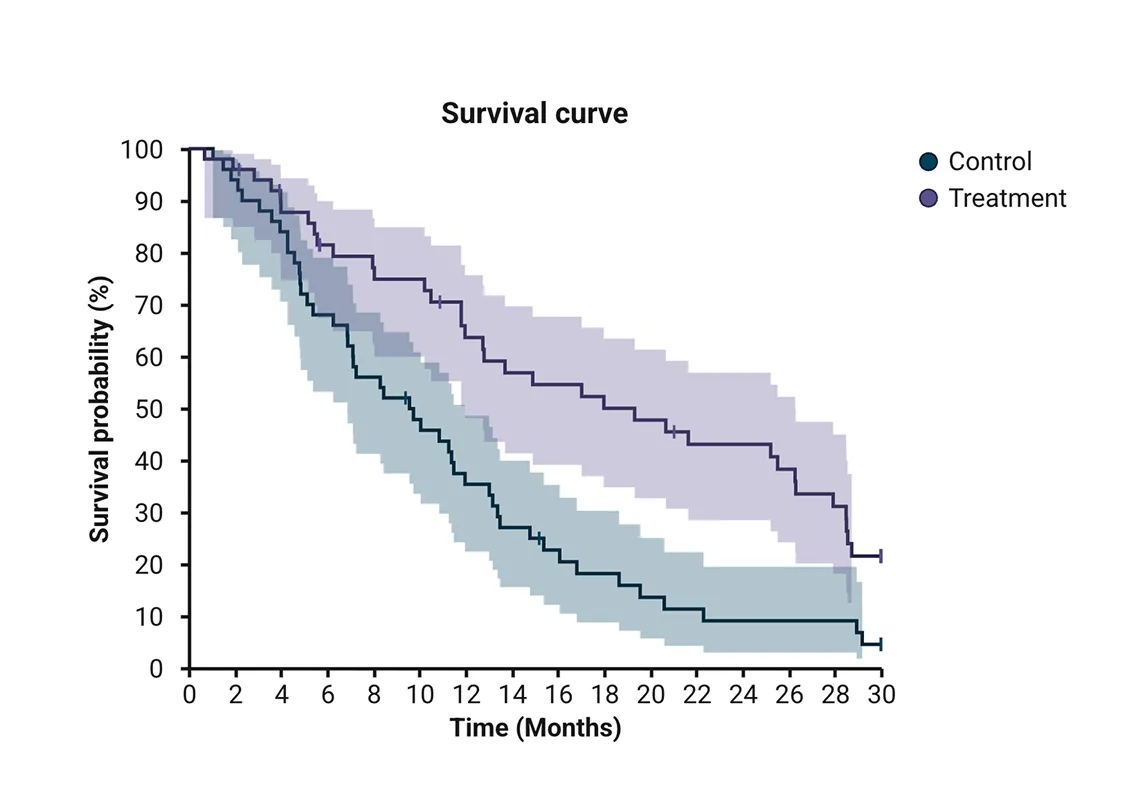
Analyze survival outcomes using Kaplan-Meier curves
Compare survival across treatment groups using Kaplan-Meier curves, log-rank test, and Cox regression, ideal for oncology, immunology, and neuroscience research.
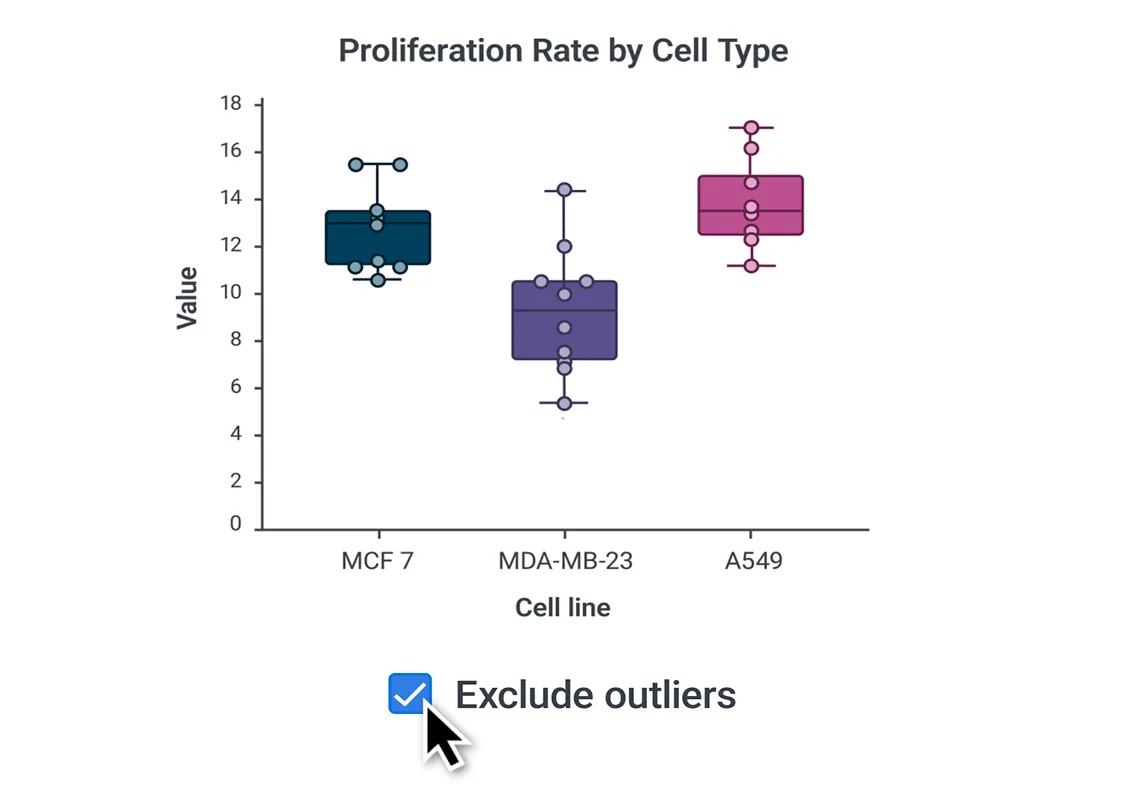
Detect outliers automatically
Detect outliers automatically, preview their impact, and exclude them in one click.
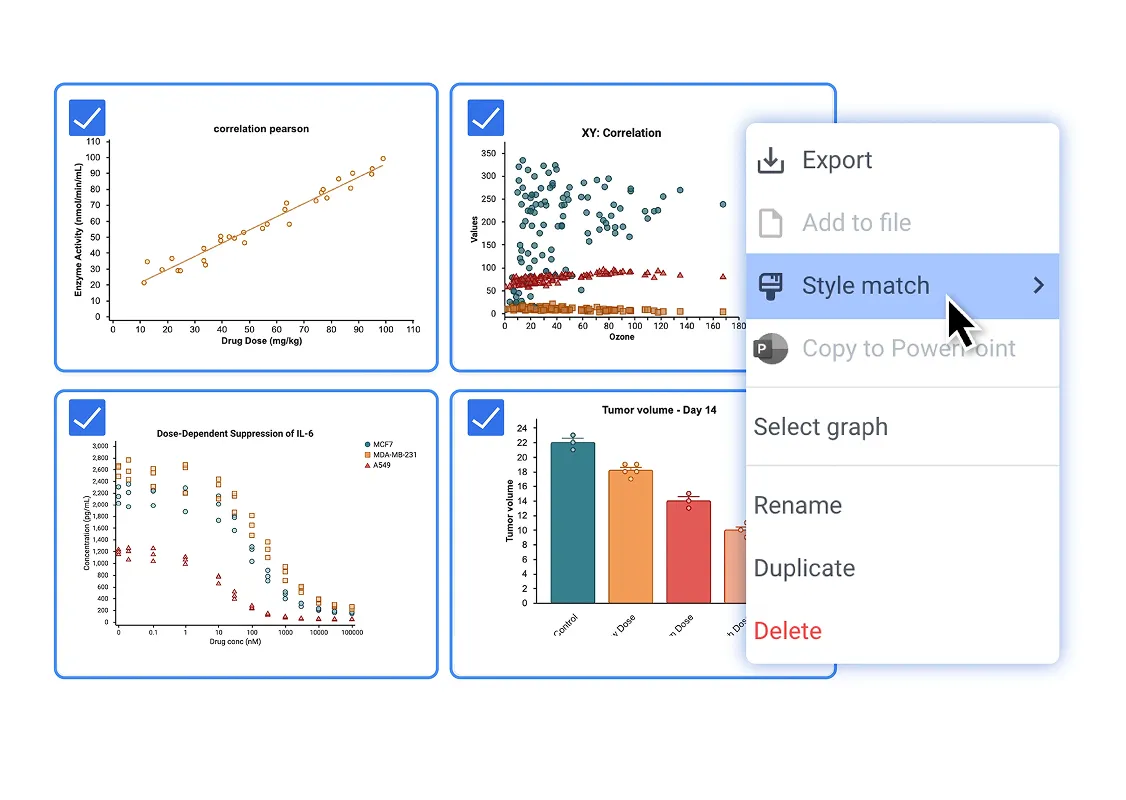
Match styles across graphs
Use Style Match to apply the same styles across graphs for consistent, polished presentations.

Move from Raw Data to Publication Quality Graphs Faster Than Ever with BioRender Graphing
BioRender Graphing turns raw data into publication-quality graphs in minutes, with automatic data prep, plain-language statistical guidance, and real-time collaboration, all in the same workspace as your BioRender figures.
Keep your data secure and controlled

BioRender is SOC 2 Type 2 certified, with encryption in transit and at rest. Your data is private by default, and access controls ensure only authorized teammates can view or edit your work. Learn more in BioRender’s Trust Center.
FAQs
BioRender Graphing is the GraphPad Prism alternative that offers the core analyses scientists rely on, without the manual steps. Import raw data without reformatting, get guided statistical analysis, and create publication-quality graphs all within BioRender. With no installation required and built-in collaboration, you can access your work from anywhere and collaborate with your team in real-time. Compare BioRender Graphing vs. GraphPad Prism.
BioRender Graphing is a cloud-based scientific data analysis and graphing tool for life science researchers. It supports t-tests, ANOVAs, nonparametric tests, dose-response curve fitting, and Kaplan-Meier survival analysis, with automatic data formatting, outlier detection, and statistical test recommendations. Graphs are publication-quality from the start, and easy to customize and sync across presentations. Access from any browser and on any device, no installation required.
BioRender Graphing supports t-tests, ANOVAs, dose-response regression, Kaplan-Meier survival analysis, and more, all computed in R for reproducible, citable results. For group comparison: t-tests, one-way and two-way ANOVAs, nonparametric alternatives, and Wilcoxon test. For regression and curves: dose-response regression with EC50/IC50 calculation, simple linear regression, simple logistic regression, and correlation. For survival analysis: Kaplan-Meier survival analysis and Cox proportional hazards regression. Statistical assumption checks include outlier detection (ROUT method), Shapiro-Wilk test of normality, Levene's test of equal variances, Mauchly's test of sphericity, and Greenhouse-Geisser correction. Review the full list of supported graph types and statistical tests.
Yes. BioRender Graphing supports simple survival analysis using the Kaplan-Meier method, as well as Cox proportional hazards regression. Import your survival data and generate publication-quality survival curves in minutes, with all analyses computed in R.
BioRender Graphing supports bar, column, boxplot, line, scatter, pie, and grouped charts, as well as survival curves and dose-response regression curves. Heatmaps, violin plots, forest plots, and volcano plots are coming soon. All analyses are computed in R for reproducible, citable results. Review the full list of supported graph types and statistical tests.
Yes. Simply drag and drop your Prism files into Graphing. Your Prism graphs are automatically recreated in the BioRender style, with your analyses intact. Learn how to import GraphPad Prism files.
BioRender Graphing calculates EC50 and IC50 values automatically through dose-response regression analysis. Simply import your data, select dose-response regression, and BioRender will generate best-fit curves, confidence intervals, and EC50/IC50 values, all computed in R for citable results.
All BioRender plans include one free Graphing file with up to three datasets. For unlimited Graphing files, paid subscribers can purchase the Graphing Add-On.
BioRender Graphing is included in all plans, with one free file and up to three datasets. To get unlimited Graphing files, BioRender subscribers with a paid plan can purchase the Graphing Add-On. Individual paid plan subscribers can log in to purchase the Graphing Add-On. If you’re on a team plan, reach out to your Admin to add the Graphing Add-On to your subscription. For pricing details, visit BioRender's pricing page or contact your CSM to learn more.
Yes. All statistical analyses in BioRender Graphing are computed in R, using documented packages and functions. This means your methods are fully transparent, reproducible, and citable.
Yes. Graphs in Graphing match the look and feel of your other BioRender figures, and can easily be added to any of your BioRender presentations or posters in high resolution. Once added to your BioRender canvas, graphs live-link to PowerPoint or Google Slides.
BioRender is SOC 2 Type 2 certified, with encryption, access controls, and continuous vulnerability monitoring. For more details, visit the BioRender Trust Center.